
Attribute MSA is a sub-topic of Measurement System Analysis. Quality control system is purely depending on your measurement system.
The measurement system consists of person, measurement device, and part.
Now in our detailed article of Measurement system analysis (MSA) we have learned that there are a data types and types of MSA studies.
So, Attribute MSA is one of the key topics that every quality engineer should know. This topic is always asked by interviewer for the position of quality engineer.
After reading this complete guide you will learn,
What is the need for attribute MSA, what are its types, when to use, and how to perform the attribute MSA study?
If you’re a manufacturing quality engineer or someone looking to improve quality control processes, understanding and implementing Attribute MSA can help to build a strong measurement system in production.
Let’s get started..

what are the Measurement systems we have? #
We have two types of data categories like variable and attributes. So we will consider the measurement system based on that data you are going to measure.
| Variable MSA | Attribute MSA |
|---|---|
| Caliper length, diameter measurement Cycle time measurement Torque measurement Flatness measurement Speed measurement | Defects (Ok, NOK) Gages check (G0, No-go) Visual defects check |
Now, we picked the Attribute MSA here. We will cover variable MSA in our different Gage R&R article.
What is Attribute MSA? #
Attribute Measurement Systems Analysis (MSA) is a method to check whether your measurement system is acceptable of not.
It helps to identify whether different operators/inspectors, methods, or gauges produce the same results to have a good quality control system.
This process checks that your measurement system is accurate and consistent.
Before dive into attribute MSA, you should understand the attribute data measurement.
When to Use Attribute MSA #
Attribute MSA is used when data is categorical. Some common examples of attribute data include:
- Pass/Fail Results: A quality inspector checks a batch of parts and mark as either “pass” or “fail” based on visual inspection.
- Go/No-Go Gauges: A product is check as either passing (go) or failing (no-go) based on its specification using gauge.
When we do measurement using visual inspection, gauge inspection or using any equipment which gives you results in categories. Those are the attribute data.
As a summary of how many types of data can be as example,
- Visual inspection: Ok or NOK, Acceptable or Not Acceptable, Good or Bad, Good or Defective.
- Gauge Inspection: Go or No-go, Pass or Fail
we select correct MSA study based on data type..

What is the purpose of Attribute Measurement System Analysis #
Below requirements and criteria need to fulfilled in manufacturing industry. And this is only done by MSA study.
Accuracy check: MSA performs to identify how good is our measurement system with our masters/references.
Precision check: To make sure that, the inspector can measure correctly. Is he checking with the same criteria across all shifts, machines, etc.…
To quantify the inspector or gauges. It means inspector or gages can accurately repeat their inspection decision.
To determine whether there is any training needed for the inspectors. The gages need any correction or adjustment necessary.
It is to determine where the standards are not clearly defined.
Let’s see the next point of Attribute MSA categories.
How to conduct Attribute MSA studies? #
There are two methods we are going to see in this article,
- Kappa Method
- Minitab Method
We will see both method with real life example.
Attribute MSA : Kappa Method #
The attribute MSA Kappa method is use to measure agreement between two appraisals or agreement between appraiser and standard reference.
In simple words, you have some reference parts which is either Go or No-Go, then this method check that how effective your measurement system to identify Ok component as Ok and NOK component as NOK.
Actual study with example on attribute MSA: Kappa method
Let’s take a example of inspection of bearing using Go, No-Go gauge.
1. Setup #
Bellow conditions we are using for our attribute study,
- Samples: 50 parts are inspected.
- Appraisers: 3 quality inspectors.
- Measurement Method: Go/No-Go gauge, which can only check parts as either “Good” (Go) or “Defective” (No-Go).
- Number of Trials per Appraiser: Each inspector will check the samples 3 times.
- Number of Samples: 50 samples are assessed.
2. Parts Selection for the Study: #
The first step in an Attribute MSA study is selection of a sample parts. For this example, we will select 50 parts from the production line, but make sure that the parts meet criteria’s:
- 26 parts are known to be “good” (Pass Go gauge).
- 24 parts are known to be “defective” (Which passes No-Go gauge).
The selected sample parts should be collected from different production shifts. We choose 50 parts to ensure enough data for meaningful analysis.
Example Parts:
- Good parts: These could include parts like properly assembled components, with correct dimension. Go gauge passing OK Parts.
- Defective parts: These could include parts with NOK dimension, and rejected from production line. No-Go gauge passing NOK parts.
3. Selecting Appraisers/Inspectors: #
In this example, we’ll select 3 appraisers (inspectors) who will check the parts as a trial and give us the results as either “good” or “defective” based on gauge inspection. The inspectors are chosen to check such that they are actually contributing the inspection process or involves in quality control.
- Appraiser 1: A shift quality inspector.
- Appraiser 2: A quality supervisor.
- Appraiser 3: A relatively new quality inspector.
4. Conducting the Study: #
- We have now 50 parts out of which 26 is OK and 24 is NOK.
- The quality engineer who conduct this study should provide the numbering to the parts. And only he knows which part is Ok and which is NOK.
- Each appraiser/inspector will check each part separately without any involvement of other inspectors.
- Quality engineer will record the respective results in sheet below.
Data #
| Sample | Appraiser 1 (Trial 1) | Appraiser 1 (Trial 2) | Appraiser 1 (Trial 3) | Appraiser 2 (Trial 1) | Appraiser 2 (Trial 2) | Appraiser 2 (Trial 3) | Appraiser 3 (Trial 1) | Appraiser 3 (Trial 2) | Appraiser 3 (Trial 3) | Reference |
|---|---|---|---|---|---|---|---|---|---|---|
| 1 | Go | Go | Go | Go | Go | Go | Go | Go | Go | Go |
| 2 | No-Go | No-Go | No-Go | No-Go | No-Go | No-Go | No-Go | No-Go | No-Go | No-Go |
| 3 | Go | No-Go | Go | Go | Go | Go | Go | Go | Go | Go |
| 4 | No-Go | Go | No-Go | No-Go | No-Go | Go | No-Go | No-Go | No-Go | No-Go |
| 5 | Go | Go | No-Go | Go | Go | Go | Go | Go | No-Go | Go |
| 6 | No-Go | No-Go | No-Go | Go | Go | Go | No-Go | No-Go | No-Go | No-Go |
| 7 | Go | Go | Go | Go | Go | Go | Go | Go | Go | Go |
| 8 | No-Go | No-Go | No-Go | No-Go | No-Go | No-Go | No-Go | No-Go | No-Go | No-Go |
| 9 | Go | No-Go | Go | No-Go | No-Go | No-Go | Go | Go | Go | Go |
| 10 | Go | Go | Go | Go | Go | Go | No-Go | No-Go | No-Go | Go |
| 11 | No-Go | No-Go | No-Go | No-Go | No-Go | No-Go | No-Go | No-Go | No-Go | No-Go |
| 12 | Go | Go | Go | Go | Go | Go | Go | Go | Go | Go |
| 13 | No-Go | Go | No-Go | No-Go | No-Go | Go | No-Go | No-Go | No-Go | No-Go |
| 14 | Go | No-Go | Go | Go | Go | Go | Go | Go | Go | Go |
| 15 | No-Go | No-Go | Go | Go | Go | No-Go | No-Go | No-Go | No-Go | No-Go |
| 16 | Go | Go | Go | Go | Go | Go | Go | Go | Go | Go |
| 17 | No-Go | No-Go | No-Go | No-Go | No-Go | No-Go | No-Go | No-Go | No-Go | No-Go |
| 18 | Go | No-Go | No-Go | Go | Go | No-Go | Go | Go | No-Go | Go |
| 19 | Go | Go | Go | Go | Go | Go | Go | Go | Go | Go |
| 20 | No-Go | No-Go | No-Go | No-Go | No-Go | No-Go | No-Go | No-Go | No-Go | No-Go |
| 21 | Go | No-Go | Go | Go | Go | Go | No-Go | No-Go | No-Go | Go |
| 22 | No-Go | No-Go | Go | No-Go | No-Go | No-Go | Go | Go | No-Go | No-Go |
| 23 | Go | Go | Go | Go | Go | Go | Go | Go | Go | Go |
| 24 | No-Go | No-Go | No-Go | No-Go | No-Go | No-Go | No-Go | No-Go | No-Go | No-Go |
| 25 | Go | Go | Go | Go | Go | Go | Go | Go | Go | Go |
| 26 | No-Go | No-Go | No-Go | No-Go | No-Go | No-Go | No-Go | No-Go | No-Go | No-Go |
| 27 | Go | Go | Go | Go | Go | Go | Go | Go | Go | Go |
| 28 | No-Go | No-Go | No-Go | No-Go | No-Go | No-Go | No-Go | No-Go | No-Go | No-Go |
| 29 | Go | Go | Go | Go | Go | Go | Go | Go | Go | Go |
| 30 | No-Go | No-Go | No-Go | No-Go | No-Go | No-Go | No-Go | No-Go | No-Go | No-Go |
| 31 | Go | No-Go | No-Go | Go | Go | No-Go | Go | Go | No-Go | Go |
| 32 | No-Go | No-Go | No-Go | No-Go | No-Go | No-Go | No-Go | No-Go | No-Go | No-Go |
| 33 | Go | Go | Go | Go | Go | Go | Go | Go | Go | Go |
| 34 | No-Go | No-Go | No-Go | No-Go | No-Go | No-Go | No-Go | No-Go | No-Go | No-Go |
| 35 | Go | Go | No-Go | Go | Go | Go | Go | Go | No-Go | Go |
| 36 | No-Go | No-Go | No-Go | No-Go | No-Go | No-Go | No-Go | No-Go | No-Go | No-Go |
| 37 | Go | No-Go | No-Go | Go | Go | No-Go | Go | Go | No-Go | Go |
| 38 | No-Go | No-Go | No-Go | No-Go | No-Go | No-Go | No-Go | No-Go | No-Go | No-Go |
| 39 | Go | Go | Go | Go | Go | Go | Go | Go | Go | Go |
| 40 | No-Go | No-Go | No-Go | No-Go | No-Go | No-Go | No-Go | No-Go | No-Go | No-Go |
| 41 | Go | Go | Go | Go | Go | Go | Go | Go | Go | Go |
| 42 | No-Go | No-Go | No-Go | No-Go | No-Go | No-Go | No-Go | No-Go | No-Go | No-Go |
| 43 | Go | Go | Go | Go | Go | Go | Go | Go | Go | Go |
| 44 | No-Go | No-Go | No-Go | No-Go | No-Go | No-Go | No-Go | No-Go | No-Go | No-Go |
| 45 | Go | Go | Go | Go | Go | Go | Go | Go | Go | Go |
| 46 | No-Go | No-Go | No-Go | No-Go | No-Go | No-Go | No-Go | No-Go | No-Go | No-Go |
| 47 | Go | No-Go | Go | Go | Go | Go | Go | Go | Go | Go |
| 48 | No-Go | No-Go | No-Go | No-Go | No-Go | No-Go | No-Go | No-Go | No-Go | No-Go |
| 49 | Go | Go | Go | Go | Go | Go | Go | Go | Go | Go |
| 50 | No-Go | No-Go | No-Go | No-Go | No-Go | No-Go | No-Go | No-Go | No-Go | No-Go |
5. Observations: #
We observe that in some cases, appraisers agrees same for the part (e.g., Appraisers 1, 2, and 3 all checked Part 1 as “Good”). In other cases, appraisers disagree, when it comes to parts check for No-Go (e.g., Part 9).
Make your observation on how many times the inspector identified correct part, as full agreement. And how many times he fails to check correct part.
| Appraiser 1 Trial = 3 Samples = 50 (26-OK, 24-NOK) Total Decision = 150 OK to OK = 65 NOK to NOK = 68 Correct Decision: 65+68 = 133 OK to NOK (False) = 13 NOK to OK (Miss) = 4 Wrong Decision: 13+4 = 17 | Appraiser 2 Trial = 3 Samples = 50 (26-OK, 24-NOK) Total Decision = 150 OK to OK = 72 NOK to NOK = 66 Correct Decision: 72+66 = 138 OK to NOK (False) = 6 NOK to OK (Miss) = 6 Wrong Decision: 6+6 = 12 | Appraiser 3 Trial = 3 Samples = 50 (26-OK, 24-NOK) Total Decision = 150 OK to OK = 68 NOK to NOK = 70 Correct Decision: 138 OK to NOK (False) = 10 NOK to OK (Miss) = 2 Wrong Decision: 10+2 = 12 |
From these observations, it’s clear that some variation exists in measurement system.
6. Kappa Calculation and Interpreting Results: #
The Kappa statistic is a measure used to assess the level of agreement between appraisers, with the agreement that could happen by chance.
The formula for Kappa is:

Where:
- Po = Observed Proportion of Agreement: The percentage of times that appraisers agree.
- Pe = Expected Proportion of Agreement: The proportion of times that appraisers would be expected to agree by chance.
Step-by-Step Kappa Example Calculation: #
Below is the table summary of all above data to calculate Po & Pe.

Calculate Po (Observed Agreement): Calculate the total number of times appraisers agreed on the correct data. For this, count the number of times appraisers check parts the same way (Go to Go, No-Go to No-Go).
Po = Total Correct decision / Total decision
| Appraiser 1 Po = 133/150 = 0.89 | Appraiser 2 Po = 138/150 = 0.92 | Appraiser 3 Po = 138/150 = 0.92 |
Calculate Pe (Expected Agreement): This is calculated based on the probability of inspector will agree or disagree on observation by chance.
Now, what is the probability that the inspector 1 will agree or disagree on the observations.
In 150 decision, inspector 1 reject the part 78 times. It is possible when he check all Go part as NoGO and all NoGo parts as Go.
Therefore, the expected value of all appraiser is in below table.
Expected count = Row total * Colum total / Total decision
Row total = Appraiser 1 expected to agree the part is bad 78 times.
Colum total = Reference part expected to be bad 69 times.

Now, the Pe values for each appraiser is,
| Appraiser 1 Pe = 0.50 | Appraiser 2 Pe = 0.50 | Appraiser 3 Pe = 0.49 |
Kappa Calculation: #
Kappa Value: Subtract the expected agreement from the observed agreement and normalize it by dividing 1−Pe.
This gives the final Kappa statistic, which is range from -1 (complete disagreement) to 1 (perfect agreement).
| Appraiser 1 Po = 0.89 Pe = 0.50 Kappa = (0.89-0.50)/(1-0.50) Kappa = 0.78 | Appraiser 2 Po = 0.92 Pe = 0.50 Kappa = (0.92-0.50)/(1-0.50) Kappa = 0.84 | Appraiser 3 Po = 0.92 Pe = 0.49 Kappa = (0.92-0.50)/(1-0.50) Kappa = 0.84 |
7. Interpreting Kappa and Final Thoughts on Acceptance Levels #
We need to interpret the data base don our calculations. For this we must know the attribute MSA study acceptance criteria. Many times you have to face this question in your quality engineer interview.
Acceptance Criteria of attribute MSA in Kappa method #
The general guidelines for Kappa interpretation and rule of thumb is:
- Kappa > 0.75: Excellent agreement.
- Kappa between 0.40 and 0.75: Moderate agreement or conditionally acceptance.
- Kappa < 0.40: Poor agreement.
In our example, with a Kappa value of 0.78, 0.84 are the excellent agreement.
What if you have a moderate or conditionally acceptance level or poor agreement.
If the deviation or defects could not affects the primary function of customer then you may accept the study conditionally and make sure you have alignment with customer in this case.
Or you can take below steps to improve your system. This suggests that the measurement process need to improve. Some steps that could help which includes:
- Again, perform Appraiser Training: Ensure that all inspectors follows the criteria and standards for measurements.
- Improving Inspection Tools: Use more simple tools, such as Go/No-Go gauges, or other alternate methods to avoid error due to measurement device.
The standard also recommend to do the calculations of effectiveness, Miss rate and False Alarm rate.
let’s now discuss Effectiveness, False Alarm Rate, and Miss Rate in this Attribute Measurement System Analysis (MSA) example.
Key Definitions:
1. Effectiveness (True Positive Rate / Sensitivity): #
This is the effectiveness of your measurement system that checks the correct parts effectively. In this case, the appraisers using the Go/No-Go gauge to correctly identify parts that are truly Good or Bad.
Effectiveness Formula:

2. False Alarm Rate (False Positive Rate): #
Good part measured as Bad is the False Alarm.
The rate at which the measurement system incorrectly measures parts as No-Go when they are actually Go.
False Alarm Formula:
False Alarm Rate = Number of wrong decision (Ok to NOK) / Total decisions
3. Miss Rate (False Negative Rate): #
Bad part measured as Good is the Miss condition.
The rate at which the measurement system incorrectly measures parts as Go (OK) when they are actually No-Go (NOK).
False Alarm Formula:
Miss Rate = Number of wrong decision (NOK to OK) / Total decisions
Acceptance criteria of Effectiveness, False Alarm Rate, and Miss Rate #
Refer below table to show the acceptance criteria of this
| Decision of Measurement System | Effectiveness | Miss Rate | False Alarm Rate |
|---|---|---|---|
| Acceptable | ≥ 90% | ≤ 2% | ≤ 5% |
| Marginally acceptable – may need improvement | ≥ 80% | ≤ 5% | ≤ 10% |
| Unacceptable – need improvement | < 80% | > 5% | > 10% |
Calculating Effectiveness, False Alarm Rate, and Miss Rate for our example
| Effectiveness | Miss Rate | False Alarm Rate | |
| Appraiser 1 | =(133/150)*100 = 89% | =(4/72)*100 = 6% | =(13/78)*100 = 17% |
| Appraiser 2 | =(143/150)*100 = 95% | =(6/72)*100 = 8% | =(6/78)*100 = 8% |
| Appraiser 3 | =(138/150)*100 = 92% | =(2/72)*100 = 3% | =(10/78)*100 = 13% |
Summary or interpretation of Results: #
- Effectiveness: 89%, 95%, 92% — The measurement system correctly checked all parts as Go to Go & NoGo To NoGO.
- False Alarm Rate:
- Appraiser 1 false alarm rate is 17% — It is unacceptable, and we need to improve our system.
- Appraiser 2 false alarm rate is 8% — Conditionally accepted. If there is no major impact on product then we can accept this result or we can improve our measurement system.
- Appraiser 3 false alarm rate is 13% — It is unacceptable, and we need to improve our system.
- Miss Rate:
- Appraiser 1 miss rate is 6% — It is unacceptable, and we need to improve our system.
- Appraiser 2 miss rate is 8% — It is unacceptable, and we need to improve our system.
- Appraiser 3 miss rate is 3% — Conditionally accepted. If there is no major impact on product then we can accept this result or we can improve our measurement system.
Recommendations: #
- Reduce False Alarms: Since there is a relatively high False Alarm Rate, it is important to calibrate the Go/No-Go gauge for accuracy or provide training to appraisers to improve their measurement techniques on No-Go parts.
- Gauge Calibration or Maintenance: The Go/No-Go gauge may need to be checked to make sure it qualifies good measurement output.
- Training: As our miss rate is also not good, for that appraisers should be trained on how to interpret results more precisely, to avoid future issues.
Now here we have successfully completed the Attribute MSA: Kappa method. Next we will see the Minitab method for the same.
Attribute MSA : Minitab Method #
These steps should be done in attribute MSA Minitab study
- Plan study
- Conduct study
- Analyze and interpret results
- Improve Measurement System if necessary
- Ongoing evaluation
Step-1 Plan Study #
Define Sample Size #
First, in the plan study, We need to define the sample size.
Based on sample size selection our study will be analyzed.
The sample size should be 30-50 samples. Or you can take base on customer requirement.
Then the next step in the plan is a selection of samples from lot/production.
- Selected samples should cover the full range of variation in the process.
- Samples should contain at least 50/50 or 30/70 Good and Bad part combinations for better results.
- A single part should have only one defect to avoid misunderstanding.
Contributing Factors for the Attribute MSA Study #
We have to think about the main contributing factors in the measurement variability,
Such as
- Operator should be trained for inspection
- A defect should be clearly understood
- The environment should be considered in the analysis, ex. Sufficient Lux level at measurement area.
Inspection work instruction #
In this stage, all the study procedures are to be well-written and documented. This will be a more effective inspection and study.
Also need to consider the blind study. Operators do not know which part they are measuring.
Step-2 Conduct study #
Now in this step, we need to take care of the time and place to conduct the study.
We need to define how we check parts in a blind study. Also how much time is required to inspect the part?
Finally, in conducting the study stage we need to observe the following conditions,
- Observed any process deviation in the process
- Observed any environmental changes while conducting the study.
- Errors in writing the inspection result
- Errors in the measurement methods.
- Operators differences / don’t disturb the operators
Now it’s time to measure and record the result on paper. The results should not be visible to the operator.
Let’s have a look on a practical example,
Practical Example: Attribute study (Minitab) #
Your company is producing the Bearing. So you need to check the bearings with the Go-NoGo gauge. Therefore your mission is to identify the defective items.
Then you will choose samples as described in the plan stage.
You must know the exact result of the samples. This means you should know which samples are OK and NOK.
So the numbering should provide on bearing to identify the sample number. A total 30 number of samples are being tested here.
2 appraisals ( 2 Operators) will check each bearings.
Each trial will be finished in 60 seconds (3 seconds/part)
Each inspector will perform 2 trails
1st Trail
2nd Trail
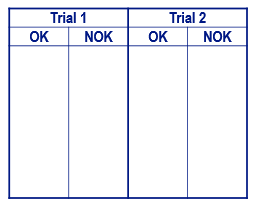
The operator writes the results on the paper ( As OK and NOK).
Be careful with the order and the OK and NOK names have to be the same as the standard used in the Minitab® worksheet.
Set up the data in Minitab® #
When the response is binary (ok – nok)
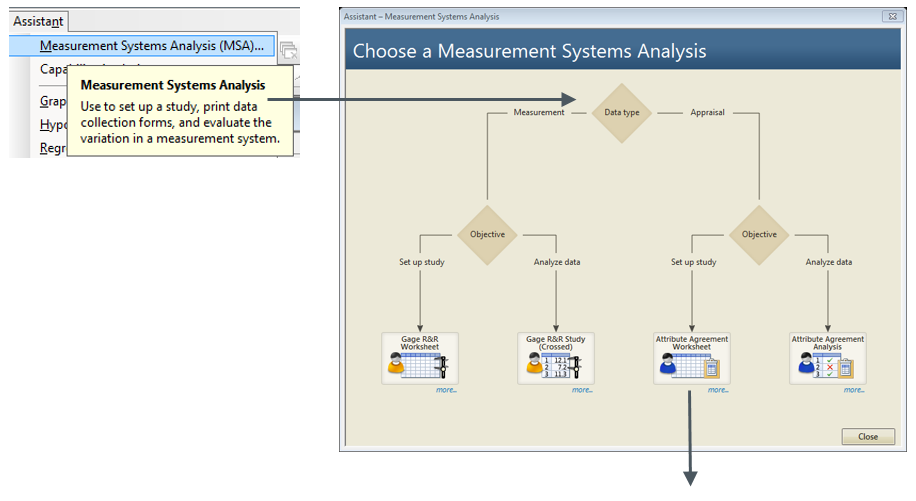
Use the Minitab: Assistant MSA > attribute agreement
When the response is ordinal or nominal (good, very good, bad, very bad, etc.)
Use Minitab feature > stat > quality tools > attribute agreement analysis
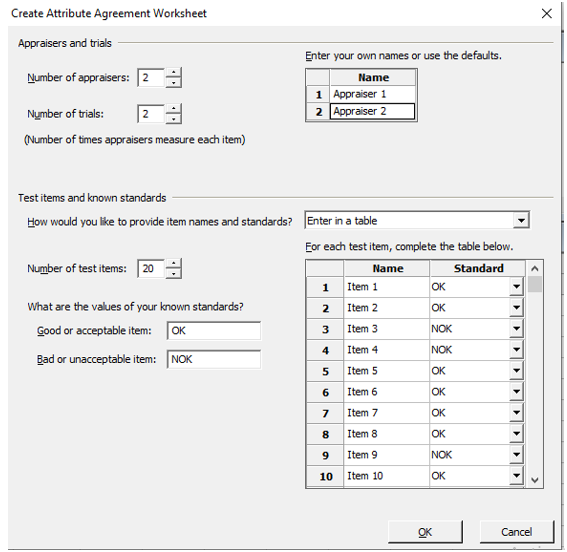
After clicking on OK, you get a new worksheet to fill in the result.

Below is the results sheet from the observation results by operators.

Step-3 Analyze and Interpret Results #
To analyze the data, go to the process shown below.
Assistant –> Measurement System Analysis –>Attribute Agreement Analysis

You will need to select the below window from the cells
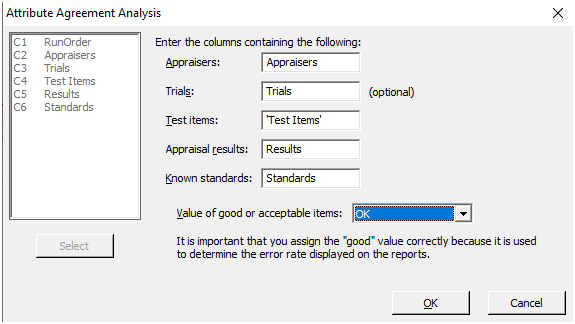
After clicking on “OK” you will get the analysis windows below to interpret the results,
1 Report Card:
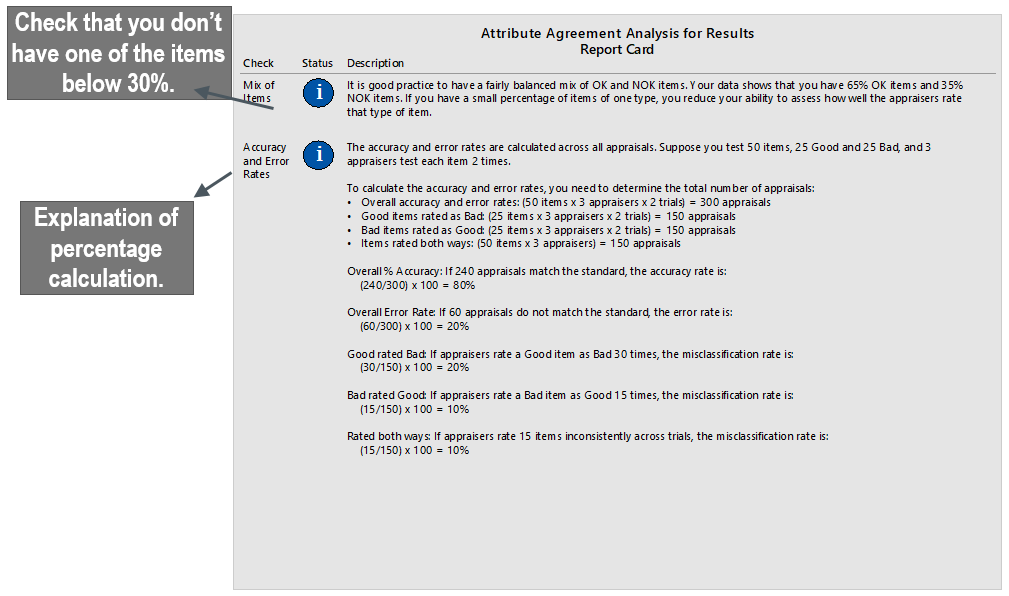
The following indicators are calculated:
- % Rated both Ways per appraiser
- % Pass rated Fail per appraiser
- % Fail-rated Pass per appraiser
- % Accuracy per appraiser
- Overall Accuracy Rate
Please refer to the screenshots of the analysis of our attribute study below,

1. % Rated Both Way Per Appraiser #
What is it?
It shows the repeatability by operator, i.e. what is the ability of each operator to ALWAYS assess a single part the same way?
How to calculate?
% Rated both ways per appraiser = number of parts not assessed consistently / number of parts assessed in %.
Example: on 20 parts, the operator assessed 18 parts the same way and 2 parts sometimes OK, sometimes NOK => % Rated both way = 2/20 = 10 %.
What will expected?
% Rated both way ≤ 10%.
2. % Pass Rated Fail Per Appraiser #
What is it?
It studies the frequency for each operator of assessing a part as NOK when it is OK in reality.
It represents the producer’s risk which is a risk to scrap or rework OK parts.
How to calculate?
% Pass rated Fail = number of time parts assessed NOK when it is OK / number of assessment with standard OK in %.
Example: on 8 parts with standard 0K, the operator assessed 1 part 1 time NOK for an OK standard => % Pass rated Fail = 1 / 8 * 2 = 6.25%.
What will expected?
% closest to 0 (green <5%, orange <10%, red >10%)
3. % Fail Rated Pass Per Appraiser #
What is it?
It gives the frequency for each operator of assessing a part as OK when it is NOK in reality.
It represents the customer’s risk which is a risk of sending NOK parts to the customer. n
How to calculate?
% Fail rated Pass = number of time parts assessed OK when it is NOK / number of assessments with standard NOK in %.
Example: on 12 parts with standard N0K, the operator assessed 1 part 2 times OK for a NOK standard => % Pass rated Fail = 2 / 12 * 2 = 8.33%.
What will expected?
% closest to 0 (green <2%, orange <5%, red >5%)
In the case of S&R characteristics, the only target is 0%

4. Accuracy Per Appraiser #
What is it?
It gives the accuracy for one appraiser which is the % of his appraisals that match the standard.
How to calculate?
Accuracy per appraiser = number of appraisals that match the standard/number of appraisals in %.
Example: on 40 appraisals (20 parts 2 trials), the operator assessed 1 NOK part 2 times OK and 1 OK part one time NOK => Accuracy per appraiser = (40-3)/40 = 92.5 %.
What will expected?
Accuracy > 90 %.
5. Overall Accuracy Rate #
What is it?
It measures the overall efficiency of the test.
It gives the accuracy for all appraisers that is the % of all appraisals which are matching the standard.
How to calculate?
Overall Accuracy = number of all appraisals that match the standard/number of appraisals in %.
Example: on 80 appraisals (20 parts 2 trials 2 appraisers), one operator assessed 1 NOK part 2 times OK and 1 OK part one time NOK and the other operator assessed 1 NOK part 2 times OK, 1 NOK part one time OK and 1 OK part one time NOK=> Accuracy per appraiser = (80-7)/80= 91.3 %.
What will expected?
Decision rules:
> 90% :
Excellent inspection process.
70 to 90% :
There must be an action plan, depending on how critical the inspection is. The inspection method, training process, boundary samples, and environment all should be verify and improved.
< 70% :
The inspection process is unacceptable. Reconsider it.
Analysis : #
Review the repeatability portion first (% Rated both Way per appraiser), if an Appraiser cannot agree with himself, ignore comparisons to Standard and to other Appraisers and go understand why.
For Appraisers that have acceptable repeatability, review the agreement with standard (% Pass rated Fail per appraiser and % Fail rated Pass per appraiser). We will know if inspectors are well-calibrated.
For appraisers that have acceptable calibration, review their accuracy.
Finally, check overall accuracy.
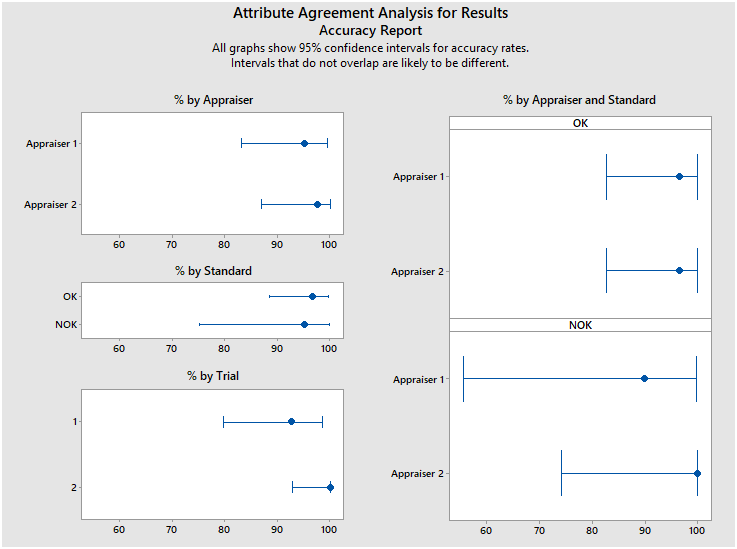
Interpret Other Graphs #
Check if there is any part assessed was mixed by all appraisers or assessed consistently by all operators but not in accordance with the process.

Check any accuracy differences (between appraisers, between standards, between trials, …) to look for ways to improve.
Step 4 – Improve Measurement System #
Once we have established we have a problem or several problems with a Measurement System, we need to figure out how to correct it.
- If the % Rated both Way for one appraiser is high, that Appraiser may need training. Do they understand the characteristics they are looking for? Are the instructions clear to them? Do they have vision issues?
- If the Accuracy per appraiser is low, the Appraiser may have a different definition of the categories than the standard– A standardized definition can improve this situation (borderline catalog).
- If a disagreement occurs always on the same part, clarify the boundary.
- If improvements made, the study should be repeate to confirm improvements have worked.
How could we improve the Measurement System for our table?
Step 5 – Ongoing Evaluation and Future Actions #
– All inspectors making this assessment in production need to validated with Attribute Gage R&R –> right assessment = validation of skill.
– Any new operator inspecting this part has to be validate with the Gage R&R.
– Frequency to revalidate inspectors has to be define.
– If a borderline catalog is changing (new defect, new boundary, …), Gage R&R has to be updated (new parts to evaluate the defect, …) and inspectors have to be re-assessed.
Conclusion on Attribute MSA #
In this way we have completed the attribute MSA topic in detailed covering Kappa method and Minitab methods.
As a documentation process attribute MSA is a auditable topic. You need to perform attribute MSA to compliance with standard and analyze your measurement system for accuracy. As a quality engineer you must have a knowledge of MSA specifically gage R&R and Attribute type.
Also after conducting the study, their acceptance criteria along with action plan if its not matches or the study is in not acceptable case.


