
In this post, you are going to understand the detailed concept of the Gage R&R (Gage Repeatability and Reproducibility) study.
The current situation #
Whether there is an internal Audit or external audit in an organization, one question is always asked by the Auditor.
Show the Measurement System Analysis study. In many companies, one standard Gage R&R Excel template is being used by engineers for this study.
Quality engineers manually fill the tables and just for document & audit purpose completes the study.
Have you observed such situation?
Just because of that many engineers don’t know exactly the concept of the Gage R&R study.
And if they don’t know, then they won’t add any value in the process improvement. Also when some questions will be asked in an interview they won’t be able to deliver the exact answer.
This complete guide is helping you to understand Gage R&R study with examples.
Why we do Gage R&R? #
One process is common in every company, and it’s nothing but the inspection process.
We are doing an inspection to capture the data from our processes. Then those data is being analyzed.
After analysis, we take some actions in the process to make improvements.
Now the problem is, if you choose the wrong data, then whatever action you take, there will be no impact on the process.
And what is the root cause of producing wrong data?
Your inaccurate Measurement System is the root cause of producing wrong inspection data.
The measurement system should have an acceptable level of variation to get accurate data.
Therefore we preferred the measurement system which has no error/variation.
To calculate the error, and variation in the measurement system, there is an effective tool called Gage Repeatability and Reproducibility (Gage R&R).
What is Gage Repeatability & Reproducibility? #
Gage repeatability and reproducibility (Gage R&R) is defined as the method to find how much of the process variation is due to the measurement equipment and measurement method.
This method is designed to find out the effects of repeatability & reproducibility separately.
And find out a combined overall error of measurement.
Also to take appropriate actions to reduce the measurement system variation contributed to total process variation.
Let’s learn what exactly Repeatability and Reproducibility are.
Repeatability – It is the variation obtained while measuring a given characteristic repeatedly on the same part.
- With one measuring instrument
- By one appraiser


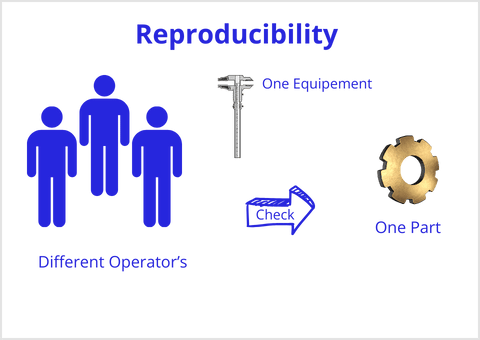
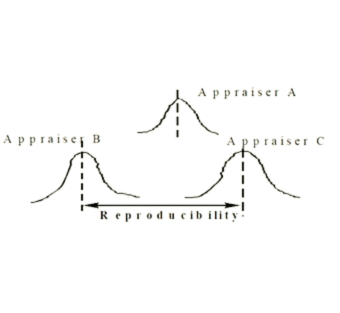
Reproducibility – Generally, It is the variation in the average of the measurement system made.
- By different appraisers
- Using the same measuring instrument
- On identical characteristics of the same part
How to perform Gage R&R study? #
There is 1 gage (Instrument/equipment), 3 different operators, a total of 3 trials and 10 components (ideally covering the Full range of the process spread) should be used.
Gage R&R Study steps
- Choose the operators who inspect the parts as Operator A, Operator B & Operator C.
- Select 10 components & identify them by numbering from 1 to 10.
- Select the Gage (Measuring Instrument) which is calibrated before being taken for trial if appropriate.
- Then Let “operator A” measure the 10 components and enter the results in a worksheet.
- Let “operator B” measure the 10 components and enter the result in the worksheet in the same order without seeing the operator A results.
- Let “operator C” measure the 10 components and enter the result in the worksheet in same order without seeing the operator A & operator B results.
- The one cycle is completed; repeat the cycle 2 times again until each operator has measured 10 components a total of 3 times. Record all results in the worksheet.
- Complete the calculation as per the standard.
Gage R&R Calculation’s
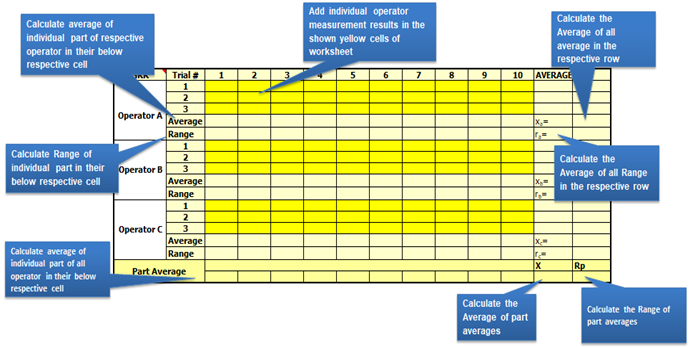
Let us take an example by putting the values from actual data. We have the data from measurement then we add this data in the worksheet as shown above.

calculate the basic terms from above data,
R = (ra + rb + rc ) / No. of operators =(0.151+0.221+0.253)/3 =0.2083
UCLR = R * D4 = 0.2083 * 2.58 = 0.538
(D4 For 2 Trials=3.27 & 3 Trials=2.58)
Now from the above example we have to calculate the following terms
- Equipment Variation (EV)
- Appraiser / Operator Variation (AV)
- Repeatability & Reproducibility (GRR)
- Part Variation (PV)
- Total Variation (TV)
- No. of distinct categories (ndc)
1) Equipment variation (EV): Repeatability
It calculates the variation one operator has when measuring the same part using the same Gage more than one time.
EV = R * K1 =0.2083 * 0.5908 = 0.12306
(K1 for 2 Trials=0.8862 & 3 Trials=0.5908)
2) Appraiser Variation (AV): Reproducibility
It is the variation in the average of measurement by different operators measure the same part using same Gage.

3) Repeatability & Reproducibility (GRR)
This is the combination of operator variation & Equipment variation….

For this example

Part Variation (PV)
It is calculated by range of the parts average, as below
For this example


5) Total Variation (TV)
Total variation is calculated for interpreting the above analysis.
For this example

6) Number of distinct categories (ndc)
The number of distinct categories (ndc) is a measure of the number of distinct categories that can be distinguished by the measurement system, so this can show that the how much your data is categorized in terms of control charts.
ndc = 1.41 (PV / GRR) =1.41 (1.101/0.208) =7
For acceptance level “ndc” value should be greater then 5.
Now finally to comparing the above data with variation in the parts,
- %EV = 100*(EV / TV) =100*(0.123 / 1.121) =10.98%
- %AV = 100*(AV / TV) =100*(0.68 / 1.121) =15.05%
- %GRR = 100*(GRR / TV) =100*(0.208 / 1.121) =18.64%
- %PV = 100*(PV / TV) =100*(1.101 / 1.121) =98.25%
GRR Acceptance Criteria
- Now If %GRR < 10% – Measurement system is acceptable
- If 10% <%GRR < 30% – Measurement system is conditionally accepted
- Then if %GRR > 30% – Measurement system is not acceptable
Interpretation from Gage Repeatability & Reproducibility study
When repeatability is large compare to reproducibility
- Instrument need maintenance
- Redesign Gage for more rigidity
- Improve location / clamping of gauging
- Excessive within part variation
When reproducibility is large compare to repeatability
- Training need to operator for better Gage measurement
- Incremental division on instrument are not readable
- Need fixture to provide consistency in Gage use.


