
An Interrelationship Diagram is a tool to find out the solution to problems which has complex relationships. OR we can say: An interrelationship digraph represents the casual relationships of related concepts or ideas. It is one of the most important tools among the 7 management tools and techniques.
It shows that each related idea can be linked logically with other ideas at a time. So that it allows us for “lateral thinking” than “linear thinking”. This type of technique is generally use after the affinity diagram which clarifies the problems or issues.
This diagram is also called: Relationship diagram, network diagram, variation matrix relation diagram.
What is the purpose of Interrelationship diagram? #
The relations diagram represents cause–and–effect relationships. Therefore this diagram is to identify the root causes and root effects of a problem. So now root causes are those factors or causes of a problem, which primarily impact other factors. And root effects are those factors of a problem, which are primarily impacted by other factors.
When to Use a Relations Diagram ¨ #
- When we try to understand links for cause and effect relationships and ideas, such as when we are going to identify the improvement area for the greatest impact.
- It uses when a complex issue or problem is needed to analyze for causes.
- When a complex solution is being implemented.
- After generating an affinity diagram, cause–and–effect diagram, or tree diagram, to more completely explore the relations of ideas.
Steps for how to construct an Interrelationship diagram :
Develop the Problem Statement
The problem is presented as a complete sentence and is made clear to all team members.
Develop Issues Related to the Problem
These issues may be the result of a previous activity such as an affinity diagram or a brainstorming session. Also each member lists five causes affecting the problem.
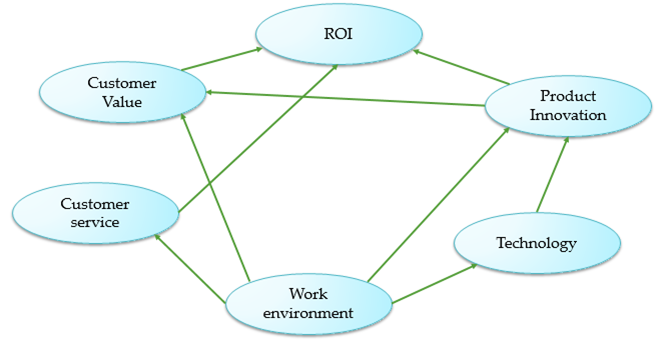
Arrange the Issues in a Circle
The problem statement is noted at the center of a piece of paper and a circle drawn around it. The header cards from the affinity diagram or the causes found after brainstorming are arranged in a circular pattern around the problem statement.
Identify Cause-and-effect Relationships
Using any of the issues as a starting point, the relationships are work in sequence. For each pair of issues, determine if there is
- no cause/effect relationship,
- a weak cause/effect relationship,
- a strong cause/effect relationship.
Draw Arrows to Indicate Directions of Influence
For each relationship pair, draw an arrow from the issue that is the cause to the issue that is influenced. And for strong relationships, use a solid line. For weaker relationships, draw a dashed line. If some relationships may seem evenly balanced, the arrow must point to stronger influence. Never draw two-headed arrows.
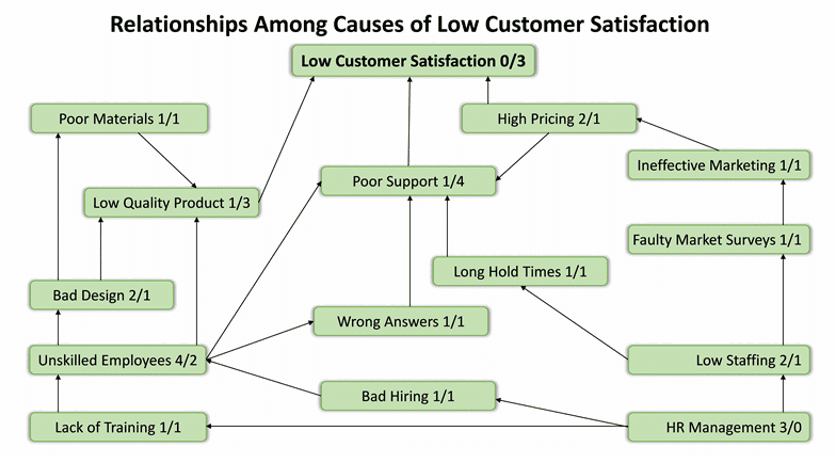
Analyze the diagram: #
Count the Arrows:
Once the analysis state is complete, the number of arrows going in and out of each category is to be count.
Identify the Root Causes and Effects:
The root causes are the categories with the greatest number of arrows going out and the effects are the categories with the greatest number of arrows going in.


