
In manufacturing and quality improvement, clarity is everything. To solve a problem or improve a process, everyone must first see how the process actually works. That’s where the Flow Chart is used as one of the 7 QC Tools.
A Flow Chart visually represents the sequence of steps in a process. It shows how inputs move through operations, decisions, and outputs.
For quality engineers, it’s an essential tool to understand, analyze, and improve processes, especially before applying other tools like the Cause and Effect Diagram or Control Chart.
Whether you’re working on an automotive assembly line or a supplier quality project, a flow chart helps your team understand the process sequence clearly and identify bottlenecks or non-value-added steps.
Concept Explanation: What is Flow chart & symbols? #
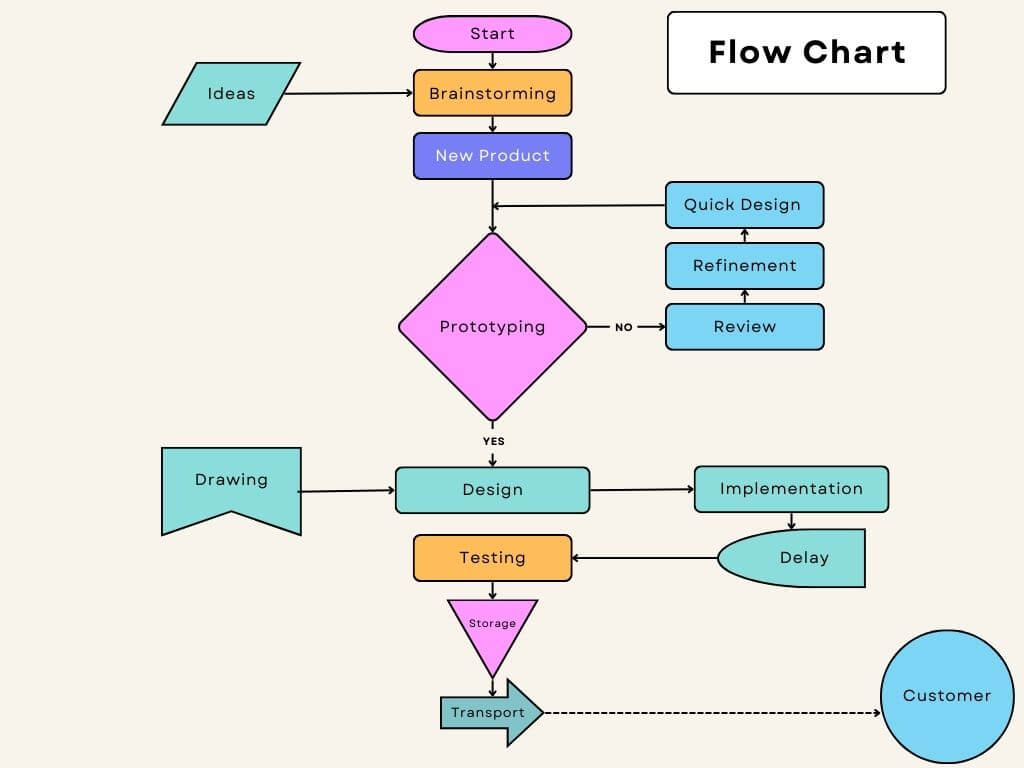
A Flow Chart (also called Process Flow Diagram) is a graphical tool that uses standard symbols to represent each stage of a process.
Each symbol has a meaning:
| Flow chart Symbols | Meaning and use cases |
|---|---|
 | Both symbols can be used for the start or end point of the process flow. |
 | Operation: Operation steps are to be written in the box. |
 | Flow line: Use to indicate the flow of the process. The flow line is an arrow line to represent the flow. |
 | Decision: Use when there is a question in the process. It should write inside the diamond and you will get a different answer. |
 | Input or output: Use to represent what input and output of the process step. |
 | Delay or wait: To show waiting in the process. |
 | Documents: What are the documents use here? What documents need to update? or Which documents are mandatory? |
 | Storage |
 | Transportation |
 | Link to another page or another flow chart |
It helps anyone, from operators to managers, to quickly understand how a process works, who performs what task, and how information or material flows through different stages.
Flow chart example
Before making a flow chart you need to understand the elements or it’s symbols.
Each symbol represents the requirement of the process.
Why it’s Important in Quality #
Flow charts help:
- Identify process redundancies and loopbacks
- Detect inefficient sequences
- Understand root causes of variation or defects
- Provide a foundation for other QC tools (like Check Sheet, Pareto Chart, and Fishbone Diagram)
Step-by-Step: How to Create a Flow Chart #
Follow these simple steps to create a professional process flow chart:
Step 1: Define the Process #
Select the process you want to document (e.g., “Welding Inspection Process”). Clearly state the start and end points.
Step 2: Identify Key Steps #
List every major operation, inspection, or decision in the process. Interview operators and review work instructions if needed.
Step 3: Arrange Steps Sequentially #
Place the steps in the correct order from start to finish. Make sure arrows show the logical flow of the process.
Step 4: Select Chart Symbols #
Use standard shapes (rectangles, diamonds, ovals, etc.) so that everyone understands the chart easily.
Step 5: Connect with Arrows #
Use arrows to connect the steps and show the direction of flow, whether forward or backward in rework loops.
Step 6: Review with the Team #
Validate the chart with the process owner or cross-functional team to confirm accuracy and completeness.
Step 7: Use it for Analysis #
Now that you have a clear visual, analyze it to find non-value-added steps, duplication, or possible failure points.
Real-World Practical Example #
Let’s take an automotive assembly example: Door Welding Process
A team creates a flow chart to visualize the steps:
Start → Load Door Panel → Welding Operation → Visual Inspection → Leak Test → OK? → Store for Next Process / Rework → End
During review, the team discovers that rework due to leak test failure often loops back to the welding station, causing delays.
This visualization makes it easy to spot the issue and helps the team plan improvements such as robot calibration or parameter optimization.

5. Advantages and Limitations #
Advantages #
- Clear visual communication of process flow
- Identifies bottlenecks and waste
- Improves understanding among departments
- Foundation for process standardization and improvement projects
Limitations #
- Can become complex for very large systems
- Needs regular updates when processes change
- Doesn’t quantify performance (needs data tools like Control Charts)
Best Practices and Tips #
- Always create the flow chart with the process team, not alone.
- Keep the layout left-to-right or top-to-bottom for readability.
- Use consistent symbols and spacing.
- Include process boundaries (start and end).
- Update the chart whenever the process changes (e.g., new station or inspection).
Common Mistakes and How to Avoid Them #
| Mistake | How to Avoid |
|---|---|
| Skipping key steps | Walk the line and observe the process physically. |
| Using inconsistent symbols | Use ISO-standard flowchart symbols. |
| Not involving operators | Always validate with those who run the process. |
| No arrows or direction | Always indicate logical flow clearly. |
| Overcomplicating | Keep it simple and understandable. |
Flow Chart Template / Checklist #
Basic Flow Chart Checklist:
- Defined process boundaries
- All steps listed sequentially
- Correct symbols used
- Flow arrows connected properly
- Reviewed and approved by team

Summary / Key Points #
A Flow Chart is one of the simplest yet most powerful quality tools to understand and improve manufacturing processes.
By visualizing each step, decisions, and feedback loops, teams can easily identify process waste, streamline operations, and ensure consistent product quality.
Before jumping into problem-solving or root-cause analysis, always start with a flow chart, it’s your roadmap to process clarity.
Ready to map your process visually? Download the free Flow Chart Template or read the next tool in the series: [Check Sheet – Complete Guide].
Frequently Asked Questions (FAQ) #
A flow chart helps visualize and analyze a process to identify inefficiencies, errors, and improvement opportunities.
You can use MS Visio, Lucidchart, Draw.io, or even Excel and PowerPoint for basic charts.
A flow chart shows the sequence of activities; a value stream map includes material & information flow plus time metrics.
Whenever the process, equipment, or inspection sequence changes.
Yes, flow charts are often used in APQP and PPAP documentation to describe process flow.


