
Here we learnt How to calculate Process Capability?, if you enjoy the content and learning kindly comments as a feedback if any improvements. You can learn or get training of Statistical Process control from AIAG.
Here we learnt How to calculate Process Capability?, if you enjoy the content and learning kindly comments as a feedback if any improvements. You can learn or get training of Statistical Process control from AIAG.
In this post you learn how process capability is calculated?
If you really want to learn detail process capability in easy way, you will enjoy and learn in this post.
The purpose of this post is you can calculate process capability by your own without any template.
It is very helpful in statistical process control (SPC)
Lets started in…

What is Process Capability? #
In process control we are used the statistical methods to improve our process. The one of Statistical Process Control (SPC) method is to calculate and analyze the process through Process capability. Cp Cpk is called as the Process capability indices. We are calculate the Cp & cpk to ensure that our production process meets the specification limits which are define by design / customer requirement. The terms as followed:
**Cp – Process Capability Cpk – Process Capability Index
In the process capability we will verify that
- How good is the process
- Is the process capable of meeting the specification
- How to analyze the process
Note for this Process capability is measure by taking the periodic samples from our production run process. These samples are taken at define frequency. For example hourly, 2 times / 3 times in shift, 5 Parts per hour etc.
For calculating the Process capability first Measurement System Analysis (MSA) of measuring instrument should be done and to learns the basics of Statistical Process Control (SPC).
Finally theory must be confusing therefore let’s taking to the Example further,
We have taken the data from the samples measurement as 5 parts / hour, data as below in the table.

Measure Data in table
Measurement of Shaft diameter with specification 20.5±0.5mm
How to calculate Process Capability for ongoing process study? #
Now for regular / ongoing process capability (Cp & Cpk) study we need to calculate the following terms,
- Calculate the Sample Average ( X̅ )
- Average of Average (X̿)
- Sample Range (R)
- Average of Range (R̅)
- Standard Deviation (б)
- Process Capability (Cp)
- Process Capability Index (Cpk)
Samples mean (Average) calculation
Calculate the sample average:

Calculate the samples mean X̿ (average of average)
the formulae

Sample Range calculation

Calculate the Average of Range (R̅)
It is the average of all Sample averages,

Calculation for Standard Deviation (б)
Standard deviation is the amount of variation present in the measure process / product characteristics. Now for regular process capability study we are using the range method to calculate standard deviation.
The Formulae for Standard deviation is,


Calculate the Process Capability (Cp)
The Cp is represent the spread of the distribution, and calculate as,

Where, USL = Upper Specification Limit LSL = Lower Specification Limit
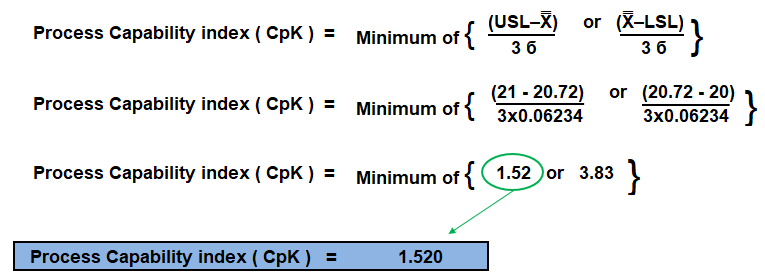
Calculate the Process Capability Index (Cpk)
The Cpk is represent the location & center tendency of the process, it shows the process is capable as well as meet the specification as per requirement and calculated as,
How we interpret the study? #
- The acceptance of study or for the capable process value of Cpk should be greater than 1.33. (Cpk ≥ 1.33)
- Therefore the relation between Cp & Cpk, Cp is always greater than or equal to Cpk. (Cp ≥ Cpk)
- let’s take the distribution curve for the example to clear the concept and interpretation of study.
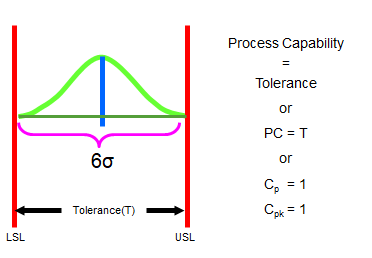
a) Cp = 1, Cpk = 1
Process capability is equal to tolerance. It is mean that Cp=1=Cpk. This process used the 100% tolerance.
b) Cp = 1.33, Cpk = 1.33
When Cp = Cpk = 1.33 it is mean that the process is using the 75% tolerance and our production run at centre of mean.

c) Cp = 1.33, Cpk < 1.33
In this scenario Cp=1.33 means process use the 75% tolerance but the Cpk show us the location / centering of process. Therefore Cpk<1.33 means the process is not at center found shift at USL / LSL.

d) Cp = 2, Cpk = 2
For Cp=Cpk=2, shows that the spread of process fits 2 times in the tolerance band 1/2=0.5, therefore 50%, means the process runs in 60% tolerance band. This process is also called Six sigma process. This is the Statistically Controlled process.

How to take action base on study? #
- After getting the Cp, Cpk value we can say that our process is cable or not, if the process is not capable then take the action base on process requirement.
- If we found that the process spread is more and process is near process mean or near center then reduce the process spread by reduce the process variation.
- And iIf we found that the process spread is less and the process is not at center, process found shifted then shift the process at center by correcting the process and shift the process parameter at mean.
- If the process is stable and capable then define the standard inspection frequency.
- Finally define your new control limit to maintain and monitored your process.
Learn more statistical methods from Statistical Process Control (SPC)


