
- What is a Cause and Effect Diagram?
- Purpose of the Tool
- How a Cause and Effect Diagram Works
- Step-by-Step: How to Create a Cause and Effect Diagram
- Practical Example: Automotive Manufacturing
- Advantages of Using Cause and Effect Diagram
- Limitations
- Best Practices & Tips
- Common Mistakes to Avoid
- Checklist / Template
- Summary / Key Points
- Frequently Asked Questions (FAQ)
In manufacturing, when defects or recurring issues happens, finding the true root cause is the first step toward improvement.
One of the most effective and visual tools used for this purpose is the Cause and Effect Diagram, also known as the Fishbone Diagram or Ishikawa Diagram.
This tool helps quality engineers systematically analyze and visualize all possible causes behind a problem. It ensures that the problem-solving process is not based on assumptions but on structured thinking and data-based discussion.
The Cause and Effect Diagram is one of the 7 QC Tools widely used in automotive and manufacturing industries to improve quality and reduce variation.
What is a Cause and Effect Diagram? #
A Cause and Effect Diagram is a graphical tool used to identify, explore, and display all potential causes related to a specific problem (the “effect”).
It resembles the skeleton of a fish, the head represents the problem (effect), while the bones branching off the spine represent different categories of causes.
The tool was developed by Dr. Kaoru Ishikawa in the 1960s and is also known as the Ishikawa Diagram.

Purpose of the Tool #
The main goal of the Cause and Effect Diagram is to:
- Identify the root causes of a problem rather than symptoms.
- Encourage team brainstorming and cross-functional participation.
- Provide a structured visual format for analyzing complex issues.
- Help in continuous improvement (Kaizen) and defect prevention.
How a Cause and Effect Diagram Works #
The diagram breaks down a problem into major cause categories, it helps teams to dig deeper.
For manufacturing and automotive applications, causes are often grouped under the 6M categories:
- Man – Human factors such as training, fatigue, or skill level.
- Machine – Equipment performance, maintenance, or calibration issues.
- Material – Quality or consistency of raw materials.
- Method – Process steps, standard operating procedures, or instructions.
- Measurement – Gauging methods, instruments, or data accuracy.
- Mother Nature (Environment) – Environmental conditions like temperature, humidity, or lighting.
These categories ensure that all possible sources are evaluated, leading to more comprehensive root cause analysis.
Step-by-Step: How to Create a Cause and Effect Diagram #
Step 1: Define the Problem (Effect)
Clearly write the specific problem you want to analyze, for example, “High rejection rate in welding process.”
Place it inside a box at the right side (head) of the diagram.
Step 2: Draw the Spine
Draw a horizontal line (the fish’s spine) pointing to the effect box.
Step 3: Identify Main Cause Categories
Branch six diagonal lines from the spine, each representing one 6M category.
Step 4: Brainstorm Possible Causes
With a cross-functional team, list all potential causes under each main branch. Use brainstorming, 5 Whys, or process walkthroughs to uncover details.
Step 5: Add Sub-Causes
Drill deeper by adding smaller branches under each major cause.
For example:
- Under Machine, sub-causes could be “improper calibration,” “worn-out tip,” or “low pressure.”
Step 6: Analyze and Identify Root Causes
Review the completed diagram and identify causes that appear most frequently or seem most impactful.
Collect data or perform experiments to confirm the true root cause.
Step 7: Implement Corrective Actions
Once verified, take corrective and preventive actions (CAPA) to eliminate or control the root cause.
Practical Example: Automotive Manufacturing #
Understanding the Problem
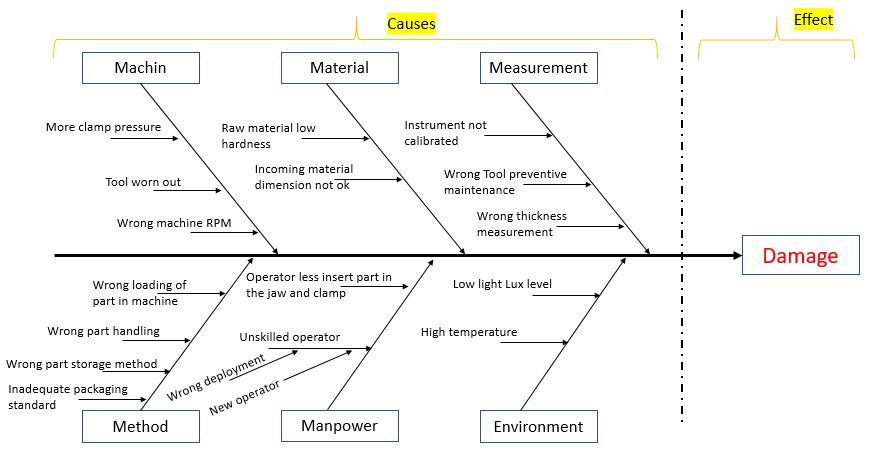
The issue under investigation was “Damage”, the effect shown at the right side of the diagram.
To find out what might be causing it, the team used a Cause and Effect Diagram to brainstorm and organize possible causes into categories.
Categories of Causes (6M Approach)
Each branch on the fishbone represents a possible source of variation or problem:
- Machine:
Problems like too much clamp pressure, worn-out tools, or wrong machine RPM could lead to part damage. - Material:
Low material hardness or incorrect incoming dimensions can make the parts weak and prone to damage. - Measurement:
Uncalibrated instruments, poor tool maintenance, or wrong thickness measurement may cause undetected defects. - Method:
Wrong loading, poor part handling, or inadequate packaging standards could physically damage components. - Manpower:
Human errors such as unskilled operators, new employees, or wrong deployment may lead to inconsistent work and damage. - Environment:
External factors like high temperature or low light levels can affect the process and lead to damage.
How the Team Used the Diagram
- The team first brainstormed all possible causes for the damage issue.
- They plotted these causes on the Fishbone Diagram under relevant categories.
- Then, they voted to identify the most likely causes that could be contributing to the problem.
Next Step – Validating Causes
Once the probable causes were selected, the team didn’t stop there. They conducted further investigation using cause validation tools like:
- Why-Why Analysis – to dig deeper into the reason behind each cause.
- Cause Validation Table / Experimentation – to confirm which causes truly affect the problem.
After this analysis, they identified the root cause, the real reason why the damage was happening.
In Simple Words
This example shows how a team:
- Faced a damage problem on the shop floor.
- Used a Fishbone Diagram to list all possible causes.
- Brainstormed and discussed with different team members.
- Narrowed down the list by voting on the most likely causes.
- Used analysis tools to confirm the true root cause.
Key Takeaway: The Fishbone Diagram helps convert team experience and observations into a structured visual format, making it easier to focus on real causes instead of random guesses. It’s not about making it perfect, it’s about getting all ideas out, then analyzing logically to find and fix the root cause.
Example 2:
Scenario:
A welding line is showing a high number of defective weld joints.
Effect (Problem): Poor weld quality.
| Category | Possible Causes |
|---|---|
| Man | Inadequate training, operator fatigue |
| Machine | Electrode tip wear, unstable current supply |
| Material | Contaminated surface, inconsistent steel grade |
| Method | Incorrect welding parameters, missing cleaning step |
| Measurement | Improper inspection gauge, misaligned sensors |
| Environment | High humidity, poor ventilation |
After analysis, the team finds the root cause to be worn-out electrode tips and lack of regular maintenance schedule.
This insight leads to preventive maintenance implementation and a reduction in defects by 60%.
Advantages of Using Cause and Effect Diagram #
- Encourages team participation and knowledge sharing.
- Provides visual clarity of complex problems.
- Helps focus on root causes, not symptoms.
- Integrates well with other QC tools like Check Sheet, Pareto Chart, and 5 Whys.
- Useful for both product and process improvements.
Limitations #
- May lead to long brainstorming sessions without focus if not guided.
- The diagram shows possible causes, not confirmed causes, data validation is required.
- Not ideal for quantitative analysis (use Control Charts or Histograms for that).
Best Practices & Tips #
- Form a cross-functional team including production, quality, and maintenance.
- Use data and evidence instead of opinions.
- Combine the tool with 5 Whys for deeper investigation.
- Keep the problem statement clear and measurable.
- Review and update the diagram after corrective actions.
Common Mistakes to Avoid #
- Starting without a clearly defined problem statement.
- Mixing symptoms with causes.
- Limiting brainstorming to one department.
- Not validating identified causes with data.
- Ignoring smaller but critical contributors.
Checklist / Template #
You can use the following checklist when conducting a Cause and Effect analysis:
| Step | Description | Status |
|---|---|---|
| 1 | Problem clearly defined | ☐ |
| 2 | Team formed | ☐ |
| 3 | Main cause categories identified | ☐ |
| 4 | Brainstorming conducted | ☐ |
| 5 | Sub-causes added | ☐ |
| 6 | Root causes validated | ☐ |
| 7 | Corrective actions implemented | ☐ |
Visual Suggestion:
Download free cause and effect excel template below:

Summary / Key Points #
- The Cause and Effect Diagram (Ishikawa Diagram) is a visual tool that helps teams identify and analyze all potential causes of a problem.
- It uses 6M categories to ensure complete coverage of potential sources.
- When combined with tools like 5 Whys and Pareto Chart, it becomes one of the most effective problem-solving tools in manufacturing.
- It helps quality engineers drive continuous improvement and defect reduction systematically.
Frequently Asked Questions (FAQ) #
ecause its structure looks like the skeleton of a fish, with the head representing the problem and bones representing causes.
It helps visualize and organize possible causes systematically, promoting team-based root cause analysis.
A cross-functional team, typically quality, production, design, and maintenance engineers.
Not necessarily, but data is essential to validate and confirm the true root cause afterward.
You can collect data using a Check Sheet, prioritize issues using a Pareto Chart, and then analyze root causes with the Fishbone Diagram.
Ready to implement this tool?
Download the free Fishbone Diagram Template and start your root cause analysis today.
Or continue learning.
Read the next QC Tool: Histogram – Complete Guide in Detail.


